|
Getting your Trinity Audio player ready…
|
This chart that I found on X is a map of everything physical we know about in the universe, organized by size and mass.
Think of it as a giant “where can things exist?” diagram.
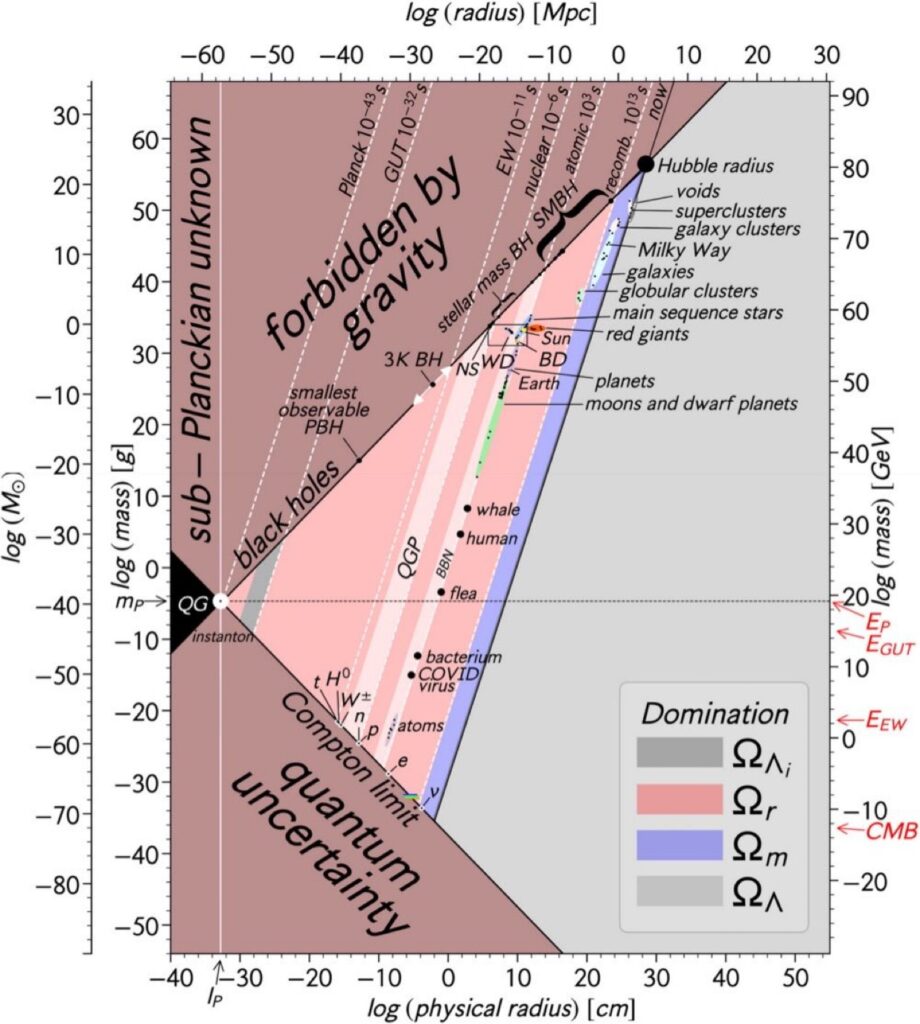
The axes
- Bottom axis = physical radius / size in centimeters, on a log scale.
- Moving right means bigger.
- Left axis = mass, also on a log scale.
- Moving up means heavier.
Because both are logarithmic, each step is a huge jump, not a small one.
So:
- lower left = tiny and light
- upper right = huge and massive
What the labeled objects are doing
The dots and labels place real things on that map:
- virus, bacterium, flea, human, whale
- Earth, Sun
- stars, galaxies, clusters, superclusters
- and even the observable universe / Hubble radius
So the diagram is showing that all known structures lie inside a certain allowed wedge-shaped region.
The big message
The chart is saying:
Not every combination of mass and size is possible.
There are boundaries set by physics.
If you try to make something:
- too small for its mass, gravity crushes it into a black hole
- too small and too light, quantum uncertainty makes the idea of a stable object break down
- too extreme below the Planck scale, our current physics stops being reliable
So the white/pink/blue wedge is basically the “allowed zone” for physical things.”
The three major forbidden regions
1.
Forbidden by gravity
(upper left pink/brown region)
This is the region where an object is too massive for how small it is.
That means gravity wins.
If you squeeze enough mass into too small a radius, you cross the black hole boundary. Above that line, objects cannot remain ordinary matter—they collapse into black holes.
That diagonal black line is basically the Schwarzschild radius condition:
- below it: normal objects can exist
- above it: they become black holes
That is why the black hole labels sit right along that border.
2.
Quantum uncertainty
(lower left brown region)
This is the region where objects are too tiny and too low-mass to behave like stable classical things.
Here quantum mechanics dominates:
- position becomes uncertain
- localization becomes fuzzy
- the object cannot really be thought of as a neat little solid thing with a well-defined size
The slanted boundary here is related to the Compton wavelength:
- if you try to pin a particle into a space smaller than this limit, quantum effects blow up and particle behavior changes dramatically
So this region means:
“You are trying to make an object too sharply localized for quantum mechanics to allow.”
3.
Sub-Planckian unknown
(far left region)
This is the area smaller than the Planck length and around the Planck mass scale.
Physics here is labeled unknown because:
- general relativity and quantum mechanics both become important
- but we do not yet have a complete theory of quantum gravity
So the chart is saying:
Beyond this point, current physics cannot confidently describe reality.
Why the allowed region is wedge-shaped
The wedge is squeezed between two limits:
- Upper limit: gravity collapse
- Lower limit: quantum fuzziness
That means stable physical objects can only live in the middle.
This is a beautiful idea:
- At one extreme, things become black holes
- At the other extreme, things dissolve into quantum uncertainty
- Between them lies the entire world of atoms, people, planets, stars, and galaxies
So ordinary reality exists in a narrow corridor between quantum chaos below and gravitational collapse above
Some important labeled zones
Atoms
These sit near the lower-middle region because they are tiny and light, but still above the quantum limit enough to be stable bound structures.
Humans / whale / flea / bacterium
These are placed to show how biological life occupies only a tiny little patch of the full mass-size landscape.
Earth / planets
Planets are much larger and more massive than living things, but still far below the black hole boundary.
Sun / stars / red giants
Stars occupy another region where gravity is strong enough to compress matter, but not enough to form black holes.
White dwarfs (WD), neutron stars (NS), black dwarfs / brown dwarfs (BD)
These are compact stellar remnants. They sit closer to the gravity boundary because they are extremely dense.
Black holes
These lie on the diagonal border where radius and mass match the black-hole condition.
Galaxies, clusters, superclusters, voids
These occupy the huge upper-right region.
Hubble radius
This marks the scale of the observable universe now.
The background colors: what dominates the universe at different scales
The legend says Domination and shows symbols like:
- Ωr = radiation
- Ωm = matter
- ΩΛ = dark energy / cosmological constant
- ΩΛᵢ likely inflationary vacuum energy at the earliest epoch
These colors are connecting mass-size scales to cosmic history.
Roughly:
- pink/red = radiation-dominated universe
- blue = matter-dominated universe
- gray = dark-energy-dominated universe
- darker gray = inflationary-vacuum-dominated early universe
So the figure is not only about objects. It is also linking size and mass scales to the eras of cosmic evolution.
The slanted dashed lines with times
These lines correspond to different moments in cosmic history:
- Planck time
- GUT era
- electroweak era
- nuclear era
- recombination
- now
They show the characteristic horizon / scale of the universe at those times.
So the chart is also telling a story of the universe expanding from an ultra-small hot state to its present size.
The Planck point
The point around:
- Planck length
- Planck mass
is special because it is where:
- quantum mechanics
- gravity
- and spacetime structure
all become equally important.
This is the crossroads where our current separate theories stop fitting together cleanly.
The deepest intuition
This figure is really a map of the constraints of existence.
It says that every object in the universe must survive between two opposite failures:
- too much mass in too little space → collapse into a black hole
- too little mass in too little space → lose classical identity to quantum uncertainty
Reality lives in the middle.
That is why the diagram feels so profound: it compresses the universe into a single picture showing that all known things—from viruses to galaxies—occupy a narrow band where physics permits structure.
In plain English
This image shows:
The universe only allows stable things to exist in a narrow range between being swallowed by gravity and being smeared out by quantum mechanics.
Everything we know—atoms, life, planets, stars, galaxies—fits inside that corridor.
If you want, I can also make this into an even simpler “tour of the chart from bottom left to top right” version.
Leave a Reply